
Disease studies, the way in which we seek to understand the endemic and epidemic conditions that afflict us, have always been a matter of landscape ecology. We think, today, about the nature of a bacterium or virus, or the insect vector that carries it. But in confronting the diseases that result, the studies are always rooted in the environments we inhabit. It's been this way since the first medical environmentalist, Hippocrates of Galen, wrote his famous Airs, Waters and Places (1), a treatise on the effect of physical surroundings on health and disease. Bad airs, soils, and habitations bred the conditions that afflicted patients. Good health came from not only a good life but a good environment. From the start, the idea of disease ecologies focused on the built environment, natural conditions, and the means by which diseases were transported between them.
A brief history of disease
In the plague years of the 14th century, Venetians created quarantines to separate vessels arriving from plague countries that might transmit it into their city (2). They knew, or suspected, it was communicable and that international trade and travel were contributors to its spread. They were also aware that it occurred more frequently at different times of the year and that local conditions could influence its virulence. It is no exaggeration to suggest that since the days of Hippocrates disease studies have focused on both the natural environment in which disease may be fostered as well as the way it is spread by humans across the systems of commerce and production. From plague to yellow fever, from Ebola to Zika, two systems of investigation have been active simultaneously. One maps the ecologies of disease generation in the landscape and the other their transmission across human ecologies of exchange. We look for the environments that promote (or inhibit) a disease--microbe or carrier--and then we look for the way in which it is carried, from one place to another.
How do viruses spread?
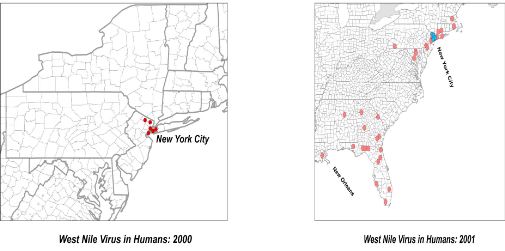
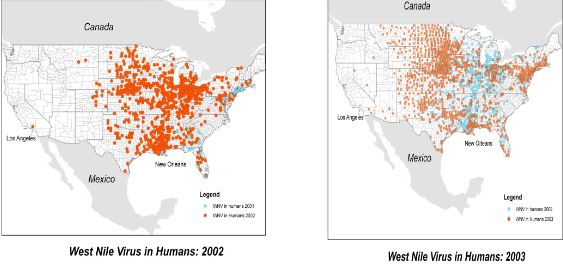
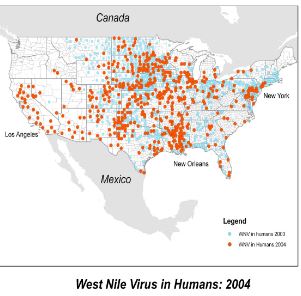
In the accompanying maps of West Nile Virus in the United States (shown below) the question asked is how did the virus spread to Florida and why did it spread so rapidly from there to the Mid-West? The pattern that unfolded over the years suggested that winter vacationers helped the spread and then Florida's exports by train and truck (citrus fruits) up the Mississippi did the rest. The question has always been which landscape dominates, built or natural, and secondly, how do these seemingly distinct studies interact? That was the question when yellow fever threatened coastal U.S. cities in the eighteenth century. Was the killing fever a natural event carried by the winds or a result of the failure of evolving cities to provide proper sanitation? Was nineteenth century cholera a similarly natural event, carried by the winds, or the result of contaminated urban water supplies? The same questions were asked again when a ferocious cholera epidemic decimated post-earthquake Haiti beginning in 2010. Was it, as some said, simply the incidence of an endemic bacterium resident in local waters or was it caused by human pollution along the Antibonite River? (3)
The five maps below illustrate the progress of the West Nile Virus (WNV) between 2001-2004 and raises questions about its spread. The early slow advance of the disease, an unexplained outbreak in Florida, and then a rapid spread up the Mississippi taken together suggests human beings were a principal source of its expansion.
Mapping an essential tool of investigation
Throughout this long history mapping has been an essential tool of investigation. It has served to organize administrative bureaucracies tasked with public health and welfare while providing a medium in which researchers argued one or another theory about disease origins or transmission routes. Maps "allow disease detectives to view illness or death patterns in space and time, showing gradual--or sometimes explosive--spread through a community, country, or even the world." (4) At the same time they also argue the precise origins of a disease event. Maps are the means by which we have long placed outbreaks, epidemics, and pandemics in a landscape of human land use and occupation. Along the way, we've learned to use the map as a method of seeing the relationship between an outbreak, bacterial or viral, and the elements of the landscape that promote or impede microbial progress. Promotion is easy (a suitable environment and unregulated trade for example). Impediments might be temperature, altitude rainfall conditions or preventive measures like quarantines to stop travel. Tracing the history of mapped disease and the current programs of mapping using digital data and computer technologies is the subject of Cartographies of Disease (5)--from early plague to modern Ebola--and a companion study of Disease Maps: Epidemics on the Ground. (6)
Simply, maps are ecologies. They take a series of presumably related events, rows in the modern database, and create a single, mappable object. These may be reports of deaths from a single disease, hospital reports of patients’ diagnoses with a specific virus, the location of a mosquito assumed to transmit or, perhaps, the water sources of a town or village. Whatever the focus, the data is then situated in a landscape that is natural (altitude, rain-fall, temperature, etc.) or human (political jurisdictions, urban streets, or housing data) to argue a relationship between place and location, on the one hand, and the disease occurrence on the other.
The famous cholera map by Physician John Snow
One of the most famous examples of this was the 1854 map of a cholera outbreak in London's St. James, Westminster district (main image). Physician John Snow mapped the outbreak across the district's stress. And then he mapped the public water sources (wells) in the same area. “Look” he said, “The cases cluster around a single pump on Broad Street and that must be the source of the outbreak”. We do the same kind of thing today. When the Ebola epidemic occurred in 2013-5 in West Africa, people mapped the villages where it began and then the cities whose populations were affected by villagers who traveled to them. Others mapped the "zoonotic niche," the range of suspected disease reservoirs and then the seasonality of disease incidence. (7) Still others, concerned with the epidemics pandemic potential, mapped possible diffusion routes from affected countries to Europe and the Americas. Understanding the epidemic required attention to both natural landscapes and the human patterns of domestication and travel that, together, explained much about the epidemic.
Landscapes are interactive environments - never simple
Today, researchers often specialize in one scale or another of investigation, natural landforms as disease incubators or human patterns of urbanization and travel. But since modern disease mapping (and disease statistics) came into being in the 19th century, time and again we've learned it isn't one or the other but both and more. Landscapes are never simple things but interactive environments. It's in the map that the complexities of interaction and mutual effect become apparent. That, at least, is the argument I have made in the books that document this history and the means by which we today confront the growing number of epidemics that increasingly threaten our cities, nations, and our world.
- Hippocrates, Airs, Waters, and Places, trans. Francis Adams (Cambridge, MA: The Internet Classics Archive), http://classics.mit.edu/Hippocrates/airwatpl.8.8.html.
- Rosen, George. 1993. A History of Public Healath, Expanded Edition. Baltimore, MD: Johns Hopkins University Press,Press, 43-46.
- Frerichs, Ralph R. 2016. Deadly River: Cholera and Cover-up in Post-Earthquake Haiti. Ithaca, NY: Cornell University Press.
- Frerichs, Ibid, p. 67.
- Koch, Tom. 2017. Cartographies of Disease: Maps, Mapping, and Medicine, Expanded Edition. Redland, CA: Esri Press.
- Koch, T. 2011. Disease Maps: Epidemics on the Ground. Chicago, IL: University of Chicago Press.
- Schmidt J. Park A.W. Kramer A. M.2017. Spatiotemporal Fluctuations and Triggers of Ebola Virus Spillover. Emerging Infectious Diseases. DOI: 10.3201/eid2303.160101.
Professor Tom Koch principal work focus is the mapping of disease and more particularly the environmental (or social) factors that inhibit or promote its progress. He has recently published the book “Cartographies of Disease --from early plague to modern Ebola--and a companion study of Disease Maps: Epidemics on the Ground”. More info about the author can be found at: http://www.geog.ubc.ca/persons/tom-koch/