
Traditionally, planners will consider the landscape of a town or city to reflect the needs of the residents, but the needs of wildlife and their connectivity throughout the city is often a second thought.
This study set out to develop a single method of identifying target areas for green space development and regeneration projects. Using Gloucester in the South west of England as the study city, the results sought to contribute to the city’s ‘Open Space Strategy 2014-2019”, delivering a city wide campaign for both access to nature and spaces for nature. Gloucester is currently proposing over the next 5 years to increase capital spending to promote open spaces, improve health and well-being, and increase the amount of wildlife management regime in open spaces. The city currently has a total of 521ha of open space covering just over 12% of the city’s total land area (Figure 1).
By using this open space data combined with research from Natural England and other sources, parameters could be set to identify regeneration target areas. These parameters include accessibility of these public open spaces for people and the connectivity of these open spaces for pollinators (the indicator group used for wildlife). Jackie explains, “My aim was to make the study as easy as possible to interpret and also replicate in order to maximise investment for human wellbeing and wildlife in the city.” The simple outputs created using a Geographic Information System (GIS) enable the council and environmental organisations to utilise the results to support habitat creation that will have multiple benefits. These maps can be particularly useful for new development proposals and urban regeneration projects.
Figure 1 (above): The study region and sites across Gloucester, South west of England. Sites are public open space owned and managed by the city council. There are other open spaces that exist across the city that may be privately owned (e.g. private gardens) or are segments of trees and grass that have not been classified as open space and have not been considered within this study.
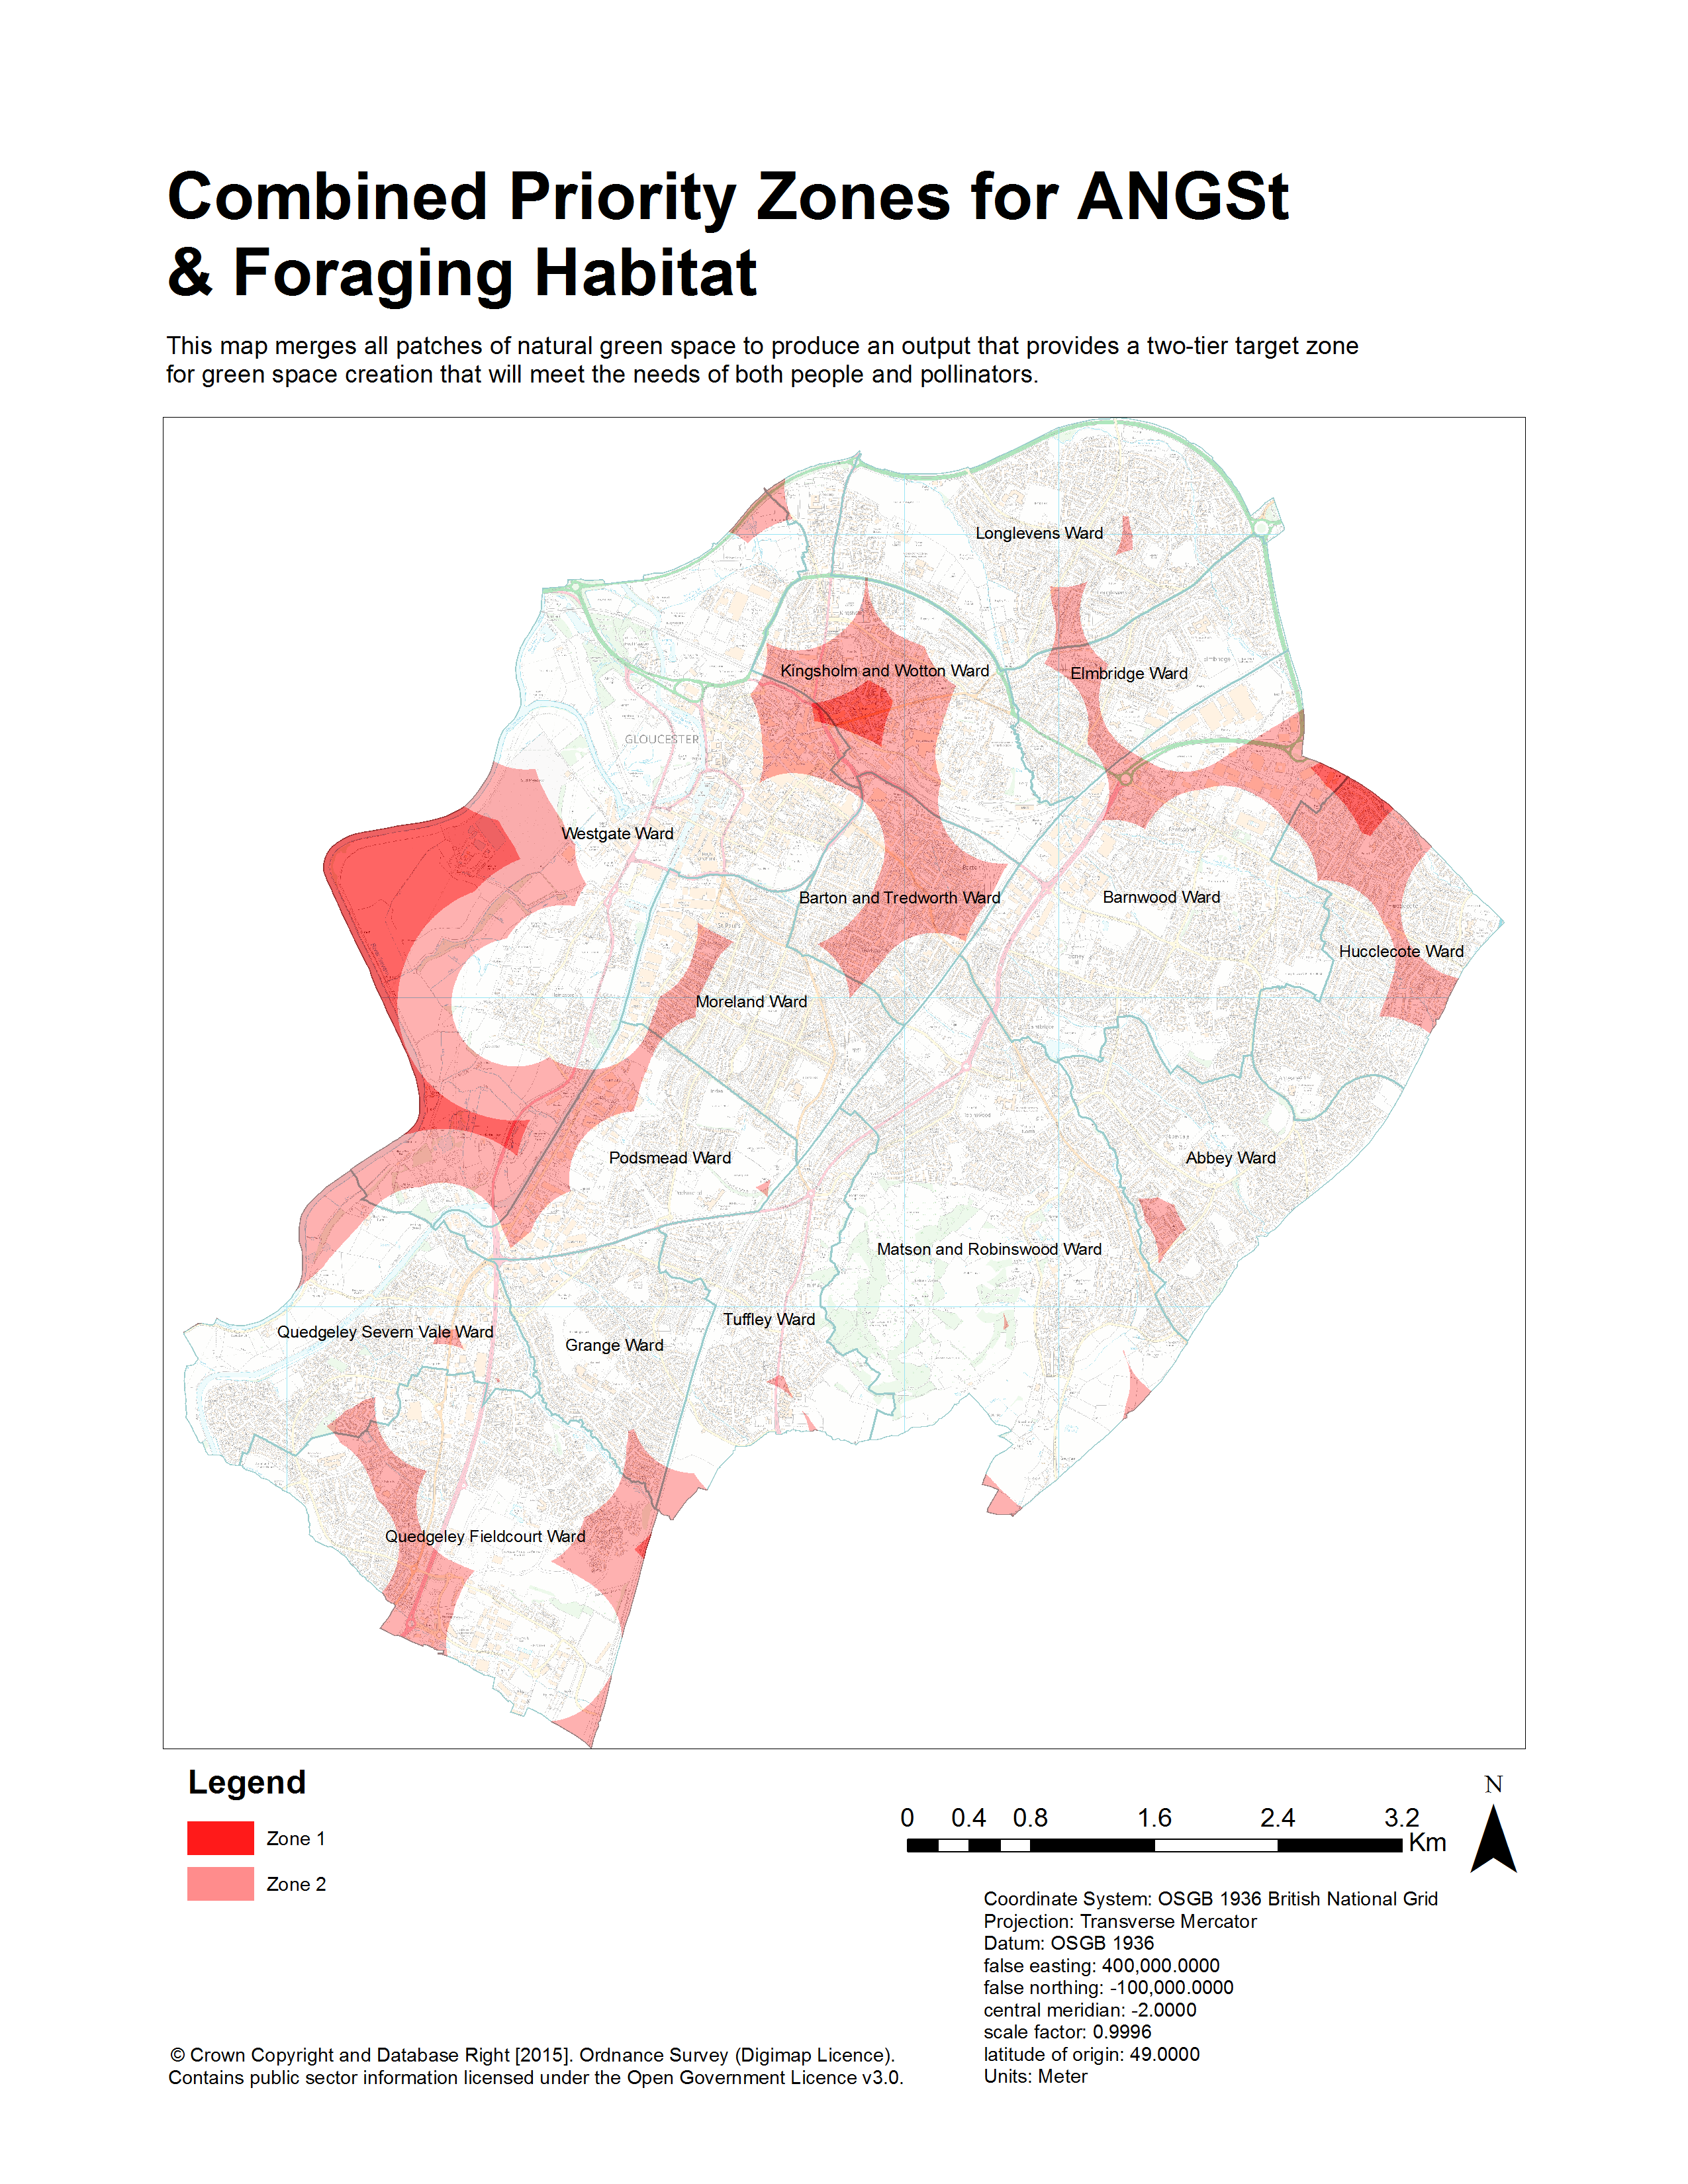
Figure 2 (below): Merges all patches of natural green space to produce an output that provides a two-tier target zone for green space creation that will meet the needs of both people and pollinators. It shows the combined priority zones for ANGSt and the foraging habitat to suit needs of human wellbeing as well as pollinator habitat connectivity. The zones are from a distance of 500m to 1000m (Zone 2) and 1000m beyond (Zone 1). The two tiers show two levels of priority for the council. The dark red is extremely deprived areas that do not have green space accessible within a 1000m distance for neither people nor pollinators (Zone 1 aka, priority 1). This gives the council a very direct target if budget is limited when it comes to rejuvenation projects. The second zone offers a wider boundary looking at those distances in excess of 500m to 1000m for accessibility and connectivity.
Methodology
The parameters for health and wellbeing were taken from Natural England’s Access to Natural Green Space Standard (ANGSt), which states: Everyone, wherever they live, should have accessible natural greenspace of at least 2ha in size, no more than 300m (5min walk) from home” (Thompson, 2010). For pollinator foraging, buffer distances were fixed at 125m, 300m, 500m, 750m and 1500m to capture the range of common bee species. Notably, 300m is the typical distance for solitary bees and 500m for common bumblebee species. Honey bees are not included as they can range up to 9km from the hive. These were run through a GIS program to highlight areas of the city that lacked the required coverage of green space to adequately meet the needs of both people and pollinators. Using the above metrics, buffer zones provide easy to interpret maps that quickly identify depravation of green space.
With more time Jackie explains that “the next step would be to look into the impact buildings and other forms of 'obstruction' have on the accessibility of green spaces for both people and pollinators. This study merely identifies accessibility and connectivity as euclidean distances or 'as the crow flies'. It does not consider genuine distances, like navigating across a busy road or around a housing estate". This means the current maps identify the minimum effort for the council to connect the city’s green spaces. Further investigation would identify much more requirement for green space provision and enhancement.”
By using the ANGSt recommendations this reduces room for wider interpretation of what is “natural space”. Looking at sites of 2ha or larger boosts the capability of a site achieving a more ‘natural’ feel to it within an urban environment, particularly for people but also for what it can offer to wildlife. However, this is limited by the vast variation in type and quality of the green space we see across our urban environments. Although not considered in detail within this study, it is a very important aspect to take into consideration for further research. However, adding complexities to such a study could limit its capability of being utilised by other organisations, so there is a fine balance needed in the extent of information gathered and the ease of output and effect.
Jackie has recently completed MSc in Conservation Ecology from Oxford Brookes University. Her thesis has been presented for numerous bodies including The Wildlife Trusts, Gloucester City Council and the European Urban Green Infrastructure Conference that was held in Vienna last year. She has also been shortlisted for the 2016 CIEEM MSc Student Project Award. Jackie is now working as a Project Coordinator & Ecologist at AECOM. If you have any questions or would like a copy of her thesis, contact Jackie Jobes at jaq.jobes@gmail.com